
Table of Contents
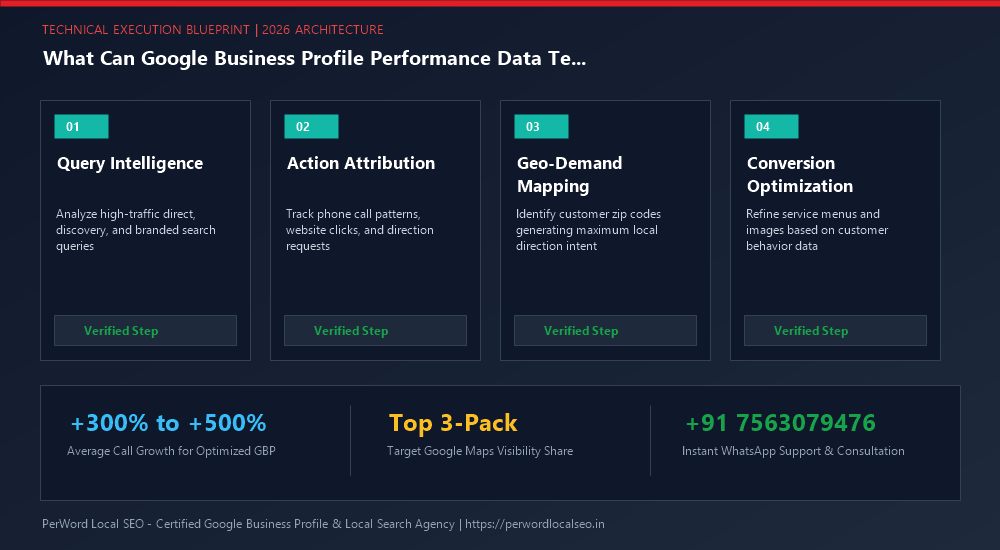
Executive Briefing: The Operational Power of Search Telemetry
Most business leaders treat Google Business Profile reports merely as an SEO scorecard. In reality, GBP Performance data functions as an advanced market sensor. It reveals when consumers experience physical pain points, which suburban communities are underserved by existing commercial infrastructure, where competitors are dropping the ball on customer service, and how operational friction (unanswered phones, misconfigured hours) leaks top-line revenue.
1. Beyond Vanity Metrics: GBP Performance as a Strategic Sensor
In traditional business intelligence, consumer demand research requires expensive focus groups, demographic census modeling, and paid surveys. Google Business Profile data, by contrast, captures raw, unvarnished consumer behavior in real time.
When an individual searches for a commercial provider on Google Maps, they are not browsing leisurely—they have an immediate operational or medical need. Evaluating search volumes, direction trajectories, and call timings provides leadership teams with actionable data to optimize operations, streamline customer support, and forecast quarterly cash flow.
2. Optimizing Staffing & Call Center Hours via Call Time Distribution
One of the most valuable reports inside GBP Performance is the hourly call distribution breakdown. By analyzing call volume mapped across the 168 hours of the week, executives uncover critical operational disconnects:
The "Early Bird" Call Surge
Many B2B, medical, and trade contractors discover that 25% of their daily call volume occurs between 6:30 AM and 8:00 AM, before front-desk staff arrives at 9:00 AM. Shift scheduling forward by 90 minutes immediately recaptures lost revenue.
The Weekend Inquiry Leak
Home service businesses frequently discover heavy call spikes on Saturday mornings from homeowners assessing week-long property issues. Implementing an on-call weekend dispatch captures dozens of high-margin emergency jobs.
3. Geographic Territory Intelligence & Physical Branch Expansion
When multi-location enterprises evaluate where to open their next physical store, clinic, or branch office, commercial real estate brokers typically rely on static foot-traffic counts. GBP Direction Request data provides superior validation:
| Expansion Metric | Analytical Indicator in GBP | Real-World Real Estate Decision |
|---|---|---|
| High Direction Request Cluster (10+ Miles Out) | A specific suburban postal code generates 200+ direction requests monthly despite long highway drive times. | Prioritize that specific postal code for next retail storefront lease acquisition. |
| High Search Volume, Zero Direction Requests | Search queries are surging in a neighboring district, but direction requests remain near zero. | Indicates heavy physical friction (congested river crossing or bridge); open satellite location. |
| Competitor Name Search Dominance | Searches for a specific rival brand represent 40% of queries in an adjacent zip code. | Deploy targeted Local SEO and promotional conquest campaigns directly into that territory. |
4. Detecting Market Demand Shifts & Micro-Seasonality
By reviewing 16 months of historical performance data, businesses can forecast micro-seasonality with surgical accuracy. For example, an automotive repair shop can identify the exact week in late autumn when battery failure queries surge with the first frost, allowing them to pre-order inventory and launch battery replacement offers before competitors react.
Want to Turn Search Data into Business Growth?
PerWord Local SEO transforms raw Google Business Profile telemetry into executive intelligence that drives hiring, marketing, and expansion decisions.
5. Spotting Competitor Vulnerabilities & Service Gaps
When you monitor query trends alongside competitor review profiles, market vulnerabilities become apparent. If search queries for "weekend emergency pediatric dentist" rise while the dominant market leader's reviews complain about weekend unavailability, adjusting your hours and service offerings instantly positions your brand to capture the displaced market share.
6. Building an Executive C-Suite Dashboard in Looker Studio
To communicate local performance effectively to stakeholders and investors, extract your GBP telemetry into Google Looker Studio. An executive-ready local dashboard should track:
- Total Unique Reach (YoY): De-duplicated human searchers across Search and Maps compared to the prior year.
- Cost Per Inbound Action: Total monthly Local SEO retainer divided by total GBP customer actions (calls, directions, clicks).
- Discovery Share Percentage: The percentage of impressions originating from non-branded problem queries versus branded terms.
7. Case Study: Urgent Care Network Scales Patient Throughput 40%
Client Profile: A network of 6 urgent care clinics in Nashville, Tennessee, was experiencing severe patient wait times on Monday afternoons while Tuesday mornings sat largely idle.
The Strategy: PerWord Local SEO conducted a multi-location GBP Performance telemetry audit:
- Analyzed hourly call and direction request distributions, discovering that patient demand peaked on Sunday evenings between 5:00 PM and 8:00 PM when clinic doors were already closed.
- Extended Sunday operating hours across all locations until 9:00 PM and added an interactive "Check Wait Times" button linking directly to real-time clinic queues.
- Launched targeted GBP post updates on Sunday afternoons announcing evening walk-in availability.
The Results: The network smoothed out Monday afternoon patient surges, captured 420 additional patient visits per month during previously closed weekend hours, and increased aggregate annual revenue by over $1.2 million across the 6 facilities.
8. Predictive Demand Forecasting & Inventory Stocking Models
Beyond operational scheduling, analyzing 12 to 16 months of historical performance data enables CFOs and supply chain directors to build predictive procurement models. Consumer search volume on Google Maps acts as a leading indicator of physical product demand.
Seasonal Inventory Allocation
Retailers and trade contractors can map historical query spikes (e.g., "generator installation" ahead of storm season or "winter tire changeover") to place wholesale bulk orders 45 days in advance, securing manufacturer volume discounts and preventing stockouts.
Cash Flow & Working Capital
Correlating historical call and booking trends allows finance teams to forecast receivables with high confidence, ensuring appropriate credit line management during seasonal lulls and funding capital expenditures ahead of peak demand cycles.